

BI Dashboards
BI Dashboards
Give executives and operational teams a clear, trusted view of performance through interactive BI dashboards.
BI Dashboards bring important measures together in a visual, decision-focused format. The service starts with the decisions users need to make, then defines KPIs, sources, calculations, targets and levels of detail. Dashboards can support executives, departments, portfolios, projects, finance, sales, customers and operations, with role-based views and controlled drill-down to supporting information.
Government and enterprise dashboards often combine several systems and reporting owners. Albrandz Technology establishes a documented metric dictionary, validation process, refresh schedule and support model so that the dashboard becomes an accepted management tool rather than another disconnected report. Albrandz Technology structures the engagement for organisations operating across Saudi Arabia, the UAE, Qatar, Oman, Bahrain and Kuwait, with clear scope, stakeholder responsibilities, review points, acceptance criteria and knowledge transfer.
What BI Dashboards Includes
KPI and User Discovery
Data Model and Integration
Dashboard Experience
Security and Publishing
Adoption and Support
GCC Delivery Considerations for BI Dashboards
Analytics delivery in the GCC often spans several systems, departments, projects or operating companies. Before publishing results, organisations need agreed KPI definitions, reconciliation with approved sources, access controls and named data owners. Government reporting may require formal review and traceability, while commercial teams may prioritise speed, forecasting and decision support. In both cases, the solution should preserve a clear link between source data, calculation, visual output and management action. Training and refresh ownership are essential if the analytics is to remain trusted after launch.
Our BI Dashboards Delivery Approach
The engagement is managed through clear stages and review gates. The exact activities are tailored to the confirmed scope, but a typical BI Dashboards assignment follows the approach below:
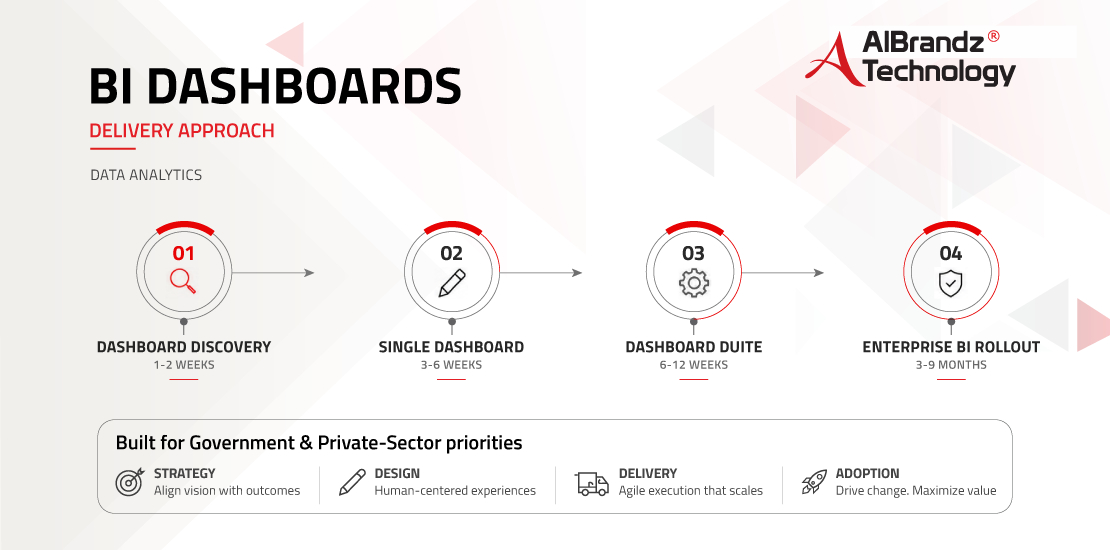
Dashboard discovery
Stakeholder interviews, KPI definitions, source review and prototype priorities. The stage includes stakeholder review, documented decisions and confirmation of the inputs required for the next phase.
Single dashboard
Data model, design, development, validation, security and user acceptance. The stage includes stakeholder review, documented decisions and confirmation of the inputs required for the next phase.
Dashboard suite
Several related dashboards, shared model, drill-down, training and deployment. The stage includes stakeholder review, documented decisions and confirmation of the inputs required for the next phase.
Enterprise BI rollout
Multiple functions, governed datasets, gateways, security, adoption and support model. The stage includes stakeholder review, documented decisions and confirmation of the inputs required for the next phase.
Discuss your bi dashboards requirements with Albrandz Technology and request a tailored GCC delivery plan.
Benefits of BI Dashboards
- Replaces fragmented spreadsheet packs with a consistent and accessible management view.
- Highlights trends, exceptions and underperformance without requiring users to analyse raw data.
- Shortens monthly and weekly reporting cycles through automated refresh and reusable models.
- Improves accountability by connecting KPIs with targets, owners and supporting detail.
- Creates governed definitions and validation rules so decision-makers can trust the resulting insight.
- Reduces recurring manual reporting and supports faster performance review across locations or functions.
Who Needs BI Dashboards?
- Executive teams requiring concise strategic, operational or portfolio performance reporting.
- PMOs and project organisations monitoring schedule, cost, risk, contracts and progress.
- Finance, sales, HR, procurement and customer-service functions with recurring management reports.
- Organisations using Power BI but lacking governed models, consistent design or reliable refresh.
- Public-sector entities requiring reliable KPIs, management reporting and evidence-based planning.
- Private enterprises seeking stronger commercial, financial or operational decision support.
How Much Time Is Needed for BI Dashboards?
Delivery time depends on scope, data and system readiness, stakeholder availability, procurement requirements, security reviews, integrations and approval cycles. Indicative delivery ranges are:
- Dashboard discovery (1-2 weeks): Delivery range subject to confirmed scope, inputs, approvals and resource availability.
- Single dashboard (3-6 weeks): Delivery range subject to confirmed scope, inputs, approvals and resource availability.
- Dashboard suite (6-12 weeks): Delivery range subject to confirmed scope, inputs, approvals and resource availability.
- Enterprise BI rollout (3-9 months): Delivery range subject to confirmed scope, inputs, approvals and resource availability.
The final schedule is confirmed after discovery and scope validation. Government programmes may require additional time for tender procedures, governance approvals, security assessment, data classification, hosting decisions and formal acceptance.